

What is the Kentucky Chamber's Economic Dashboard?
The Kentucky Chamber’s Economic Dashboard provides timely updates on economic conditions in Kentucky and across the United States. It tracks key indicators, including employment, workforce participation, hiring, inflation, consumer sentiment, and small business optimism, to help business leaders and policymakers understand current trends.
Current Economic Snapshot
- After a bad year for jobs, Kentucky gradually recovers in 2026. Kentucky lost 5,700 jobs last year but has gradually rebounded throughout 2026, averaging 571 new jobs per month.
- The labor market appears stable. Unemployment in Kentucky, at 4.7%, is running higher than the U.S., but unemployment in both the state and nation was stable in the most recent months. Employment and labor force participation improved for both last month.
- High inflation shows few signs of abating. Inflation in the U.S. has run above 3% for the past seven months. Tariffs had a significant impact on inflation from April 2025 through March 2026.
- Diesel and other energy prices are surging. The cost of diesel is now 88% higher than before the Iran conflict began and is being exacerbated by global refining disruptions. Diesel prices have major impacts on business costs, which is already evident in some inflation measurements.
- Consumer sentiment falls again. Consumer sentiment is currently estimated at 14.2% lower than a year ago, as consumers anticipate worsening economic conditions due to high fuel prices and renewed trade tensions.
This information is meant to provide a monthly check-in on the most recent economic data in Kentucky and the U.S. It is not comprehensive. For additional information on Kentucky’s economy, we recommend resources like Blueprint Kentucky’s annual report on Kentucky’s Rural Economy and the UK’s Annual Economic Report.
Here are more details on the state of the economy as of September 14, 2026.
Job Growth
Kentucky continues to recover from last year’s job losses.
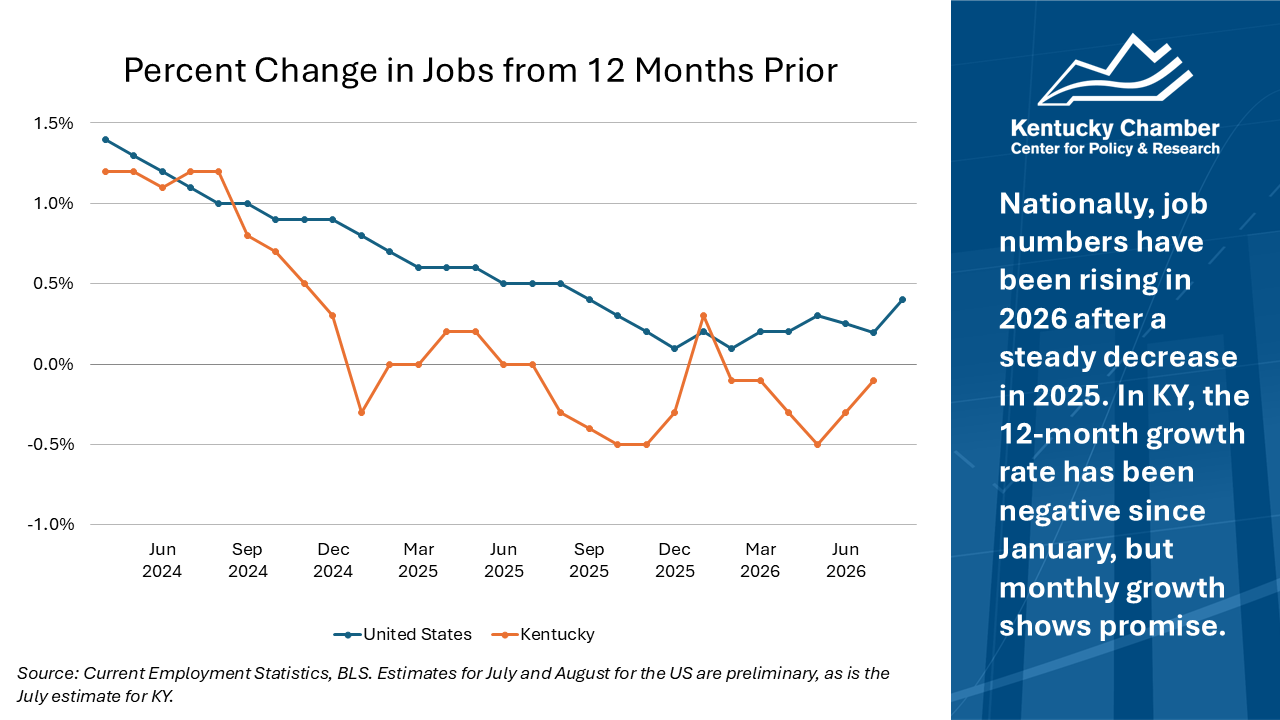
- 2025 was a rough year for jobs: Kentucky lost jobs throughout 2025, ending the year with 5,700 fewer jobs than we started with.
- A gradual recovery in 2026: 2026 has been a more positive year for growth in Kentucky, with the state averaging 571 new jobs per month, so far. When measured year-over-year, however, job growth has been negative for the past six months in the state. This means each of these months had fewer recorded jobs than the previous year.
- The national picture: At the national level, the first eight months of 2026 have been positive. The U.S. added an average of 80,375 jobs per month so far in 2026. This follows a lackluster 2025 (like Kentucky), when the U.S. added only 181,000 jobs across the whole year.
- How we look at jobs: The chart above displays job growth by showing the 12-month change in jobs as a percentage, which allows for more direct comparisons between Kentucky and the U.S. and removes the seasonality of month-to-month changes.
Unemployment
Unemployment appears largely stable, at least nationally.
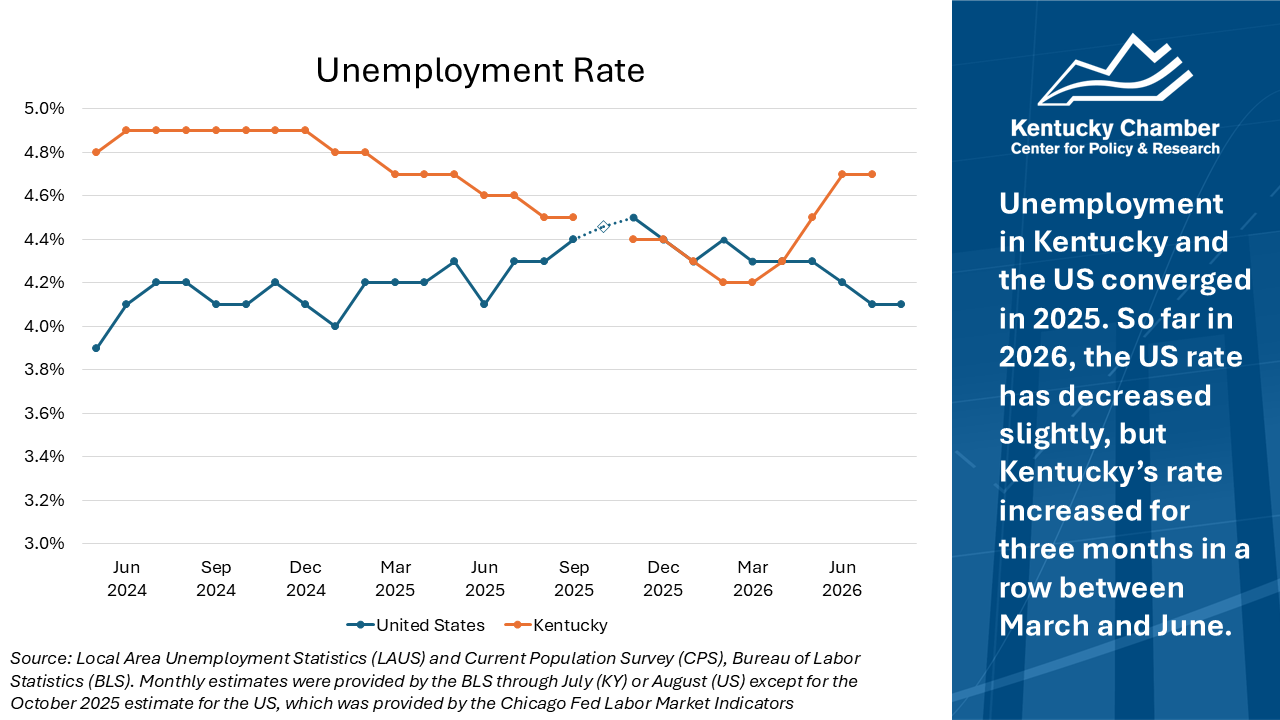
- Kentucky unemployment holds steady after an uptick: The preliminary estimate for July 2026 suggests that the unemployment rate in KY has stayed around 4.7%. The number of unemployed increased but was balanced by an increase in labor force participation. Unemployment rose in the state from March 2026 to June 2026.
- National unemployment is steady: So far in 2026, the national unemployment rate has improved slightly. It fell in June and July to 4.1%, which is the lowest it’s been since June 2025, and changed very little in August.
- Factors shaping unemployment: When unemployment is broken out by reasons for unemployment at the national level, the biggest change last month was increases in unemployment due to leaving a job. This may be a positive development and could reflect workers’ confidence in finding new opportunities.
- County-level variations: Unemployment rate estimates are available at the county-level in Kentucky, but they are not seasonally adjusted. County unemployment rates vary widely across the state, with certain counties in eastern Kentucky reaching as high as 10.1%. For comparison, Kentucky’s non-seasonally adjusted unemployment rate for July was 5.1%. It is important to note that county-level estimates are not produced using the same methodology as state or national estimates because few if any households are interviewed in smaller counties.
- What “unemployment” means: Unemployment is defined as not being employed and actively searching for a job. People who don’t have jobs and are not actively searching are counted as being out of the labor force. The unemployment rate can fall or rise as people have an easier or harder time finding a job; but it can also fall if people without jobs leave the labor force or rise if more people enter the labor force.
- Measuring layoffs: The unemployment rate is often not an ideal way to measure layoff activity. Unemployment insurance claims and JOLTS data are better alternatives. Claims increased more in KY than in the U.S. for most of 2025; however, claims have fallen for the state and nation since January 2026, and initial claims are now lower in KY than in the U.S. JOLTS data show that layoffs, as well as hiring, are low for the U.S.
Inflation
Inflation has been above 3% for 7 months now.
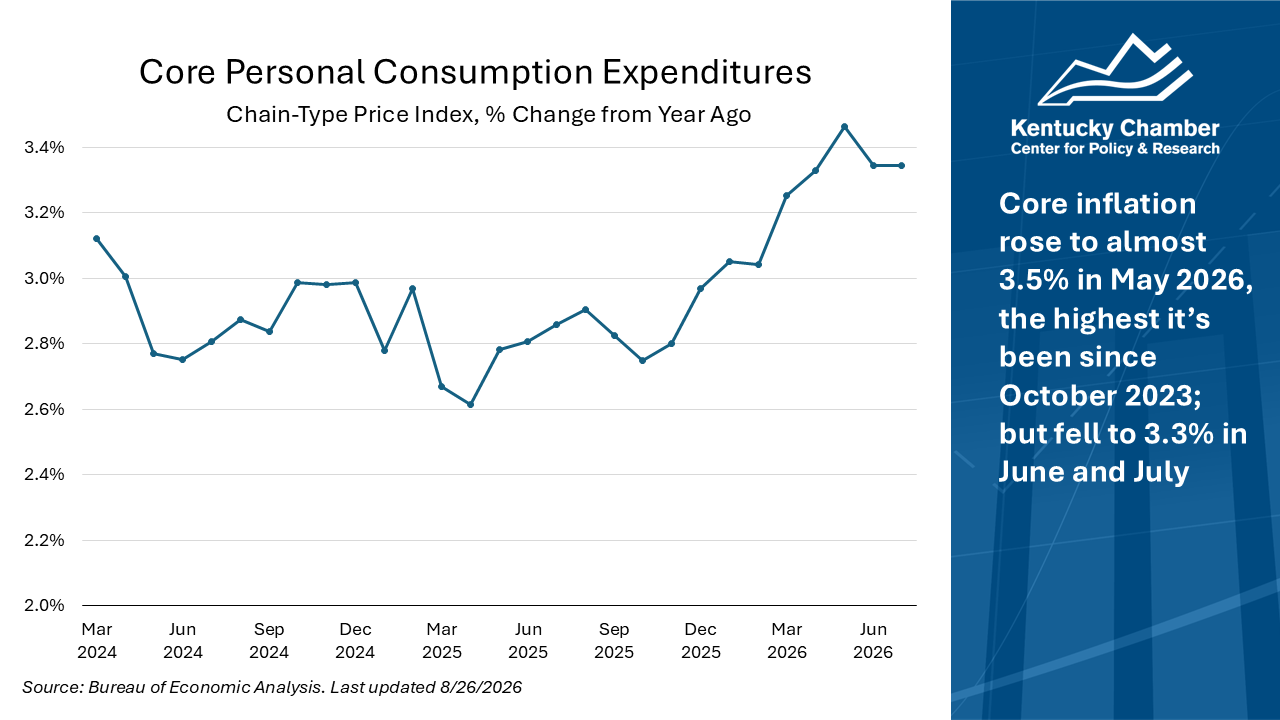
- Core PCE & the Fed: Core Personal Consumption Expenditures (PCE), which excludes food and energy, is the Federal Reserve’s preferred inflation metric. The Fed targets 2% inflation, which the US has not seen since 2021. Food and energy are excluded because they tend to be more volatile.
- Current rates: Inflation in July 2026—at 3.3%—was nearly 0.5% higher than in July 2025. The steady 12-month percentage change in July 2026 corresponded in a month-to-month increase in prices of 0.2%, compared to 0.1% in June and 0.4% in May.
- Tariffs have contributed to inflation: The increase in inflation shown from April 2025 to March 2026 was consistent with the effects of high, and often volatile, tariffs. Analysts at the Federal Reserve, for example, estimate that tariffs accounted for 0.8 percentage points of the March 2026 Core PCE reading. Absent tariffs, the reading that month would have been 2.3% instead of 3.1%.
- Iran impact on inflation: The effects of the war with Iran on Core PCE in June and July are probably small, but still present. The spike in energy prices due to the war in the Middle East will be felt by consumers and businesses more quickly than they show up in core PCE, which excludes food and energy prices. Indirect effects on core inflation will show up in various ways, such as higher shipping costs. Other inflation measures are already picking up these impacts.
Energy Prices
Diesel prices are surging due to global disruptions.
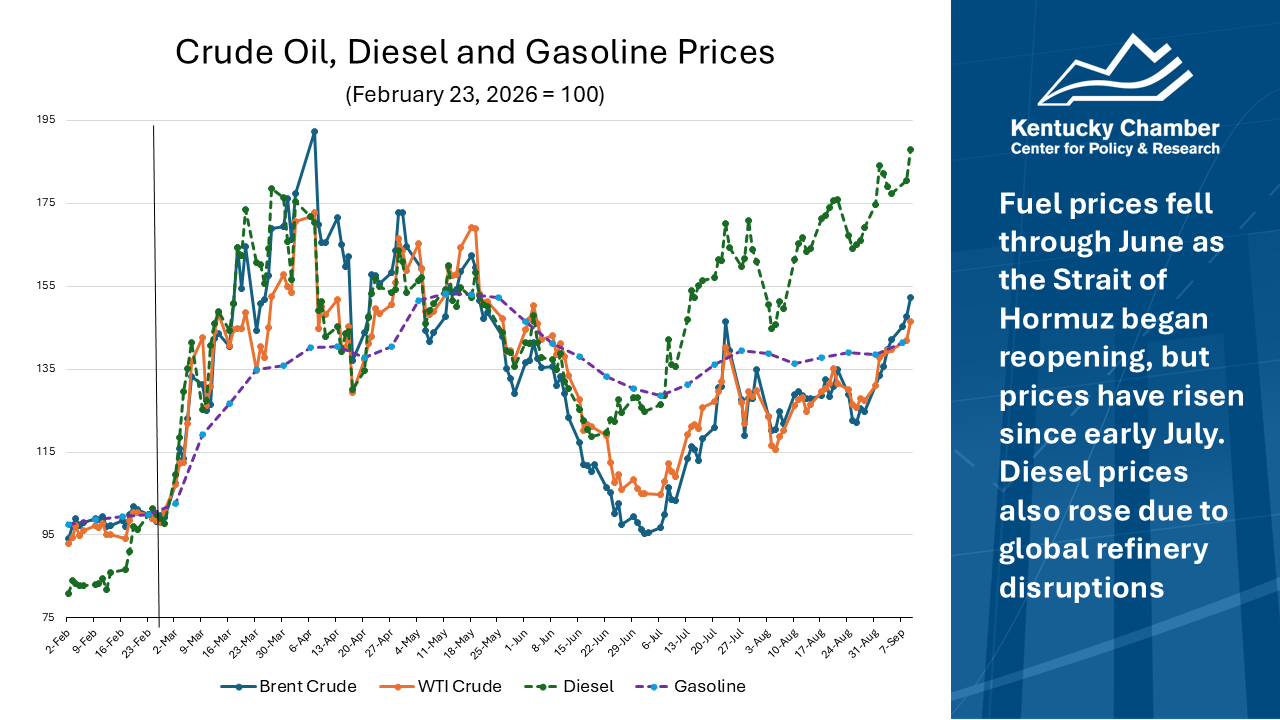
- Indexing energy prices: This chart indexes prices for diesel, gasoline, West Texas Intermediate Crude oil (the standard benchmark for U.S. produced oil prices), and the international traded Brent Crude oil (the standard global benchmark) to February 23, 2026, just before the conflict with Iran started.
- Prices and the Iran conflict: Energy prices are being heavily impacted by the conflict with Iran. Prices surged when the conflict began; declined once a temporary peace agreement was announced; and rose again when hostilities restarted.
- Gasoline Prices: Gasoline prices also fell through June, but less than crude oil prices. They then rose again in July and August. Gasoline is 42% higher than it was before the conflict.
- Diesel Prices: Due to global refining disruptions, diesel prices started rising in mid-June, separating from movement in crude oil prices. Diesel is 88% higher than before the Iran conflict began due to the combined oil and refining effects.
- Impacts: Diesel prices will have greater impacts on costs to businesses due to how they influence shipping expenses, while gasoline prices will disproportionately affect everyday households. One measure of price changes for businesses—the Producer Price Index, Intermediate Demand—surged from 2.8% in January 2026 to 12.4% in May 2026.
- Prices: Gasoline prices tracked are “US Regular All Formulations Gas Price” as tracked by the U.S. Energy Information Administration. AAA tracks gas prices by formulation. As of 9/11/2026, the national average price for a gallon of regular gas is $4.295, compared to $3.195 one year ago. Diesel is $6.056 now, vs $3.705 a year ago. In Kentucky, regular is $4.010, and diesel is $5.746 compared to $2.862 and $3.402 one year ago. Current gasoline and diesel prices are also higher than they were a month ago.
Consumer Sentiment
Consumer sentiment falls again.
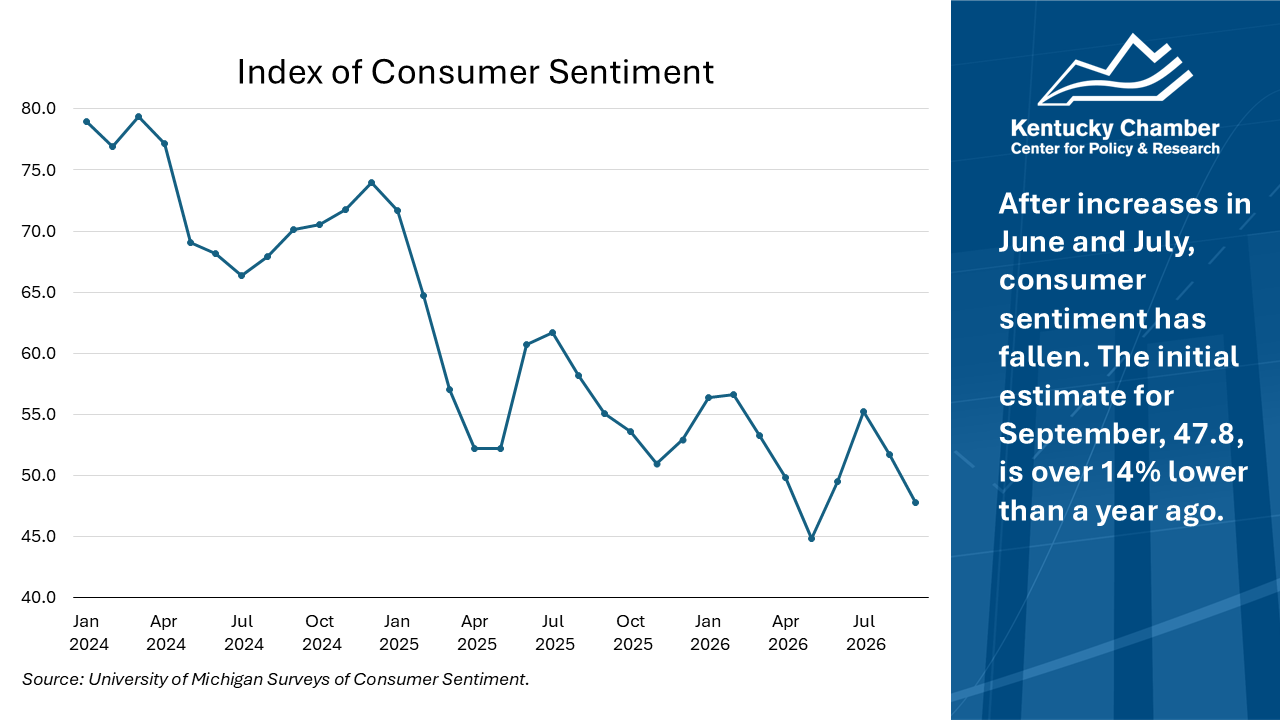
- Consumer sentiment. The University of Michigan produces an index of consumer sentiment and updates it monthly.
- A decline after a rebound. The preliminary estimate for September 2026, 47.8, is 7.8% lower than the final estimate for August, 14.2% lower than the estimate 12 months earlier, and 16.9% lower than it was in February before the conflict with Iran began.
- Fuel prices and tariffs. Increased fuel prices and renewed trade tensions drove worsening expectations for both personal finances and business conditions, which were mentioned as reasons for the decrease. Sentiment declined strongly for both Republicans and Democrats, but was relatively stable for independents.
- About the historic lows. Note that the fact that the May number is a historic low may be due to changes in how the survey was conducted between April and July of 2024. The fact that the index has been declining is much more reliable and relevant than comparisons to historic values.
About This Data
On this web page, we provide economic updates on Kentucky and the United States, using a range of key metrics from the U.S. Department of Labor, U.S. Bureau of Economic Analysis, the University of Michigan, the St. Louis Federal Reserve, and the U.S. Chamber of Commerce. All data is analyzed by the Kentucky Chamber Center for Policy and Research. On this page, we cover jobs, unemployment, unemployment insurance claims, hiring, workforce participation, inflation, consumer sentiment, and small business optimism.
Sources
Federal Reserve Bank of St. Louis, Federal Reserve Economic Data
MetLife and U.S. Chamber of Commerce, Small Business Index
University of Michigan, Survey Research Center, Surveys of Consumers
U.S. Bureau of Economic Analysis, Personal Consumption Expenditures Price Index
U.S. Bureau of Labor Statistics, Local Area Unemployment Statistics
U.S. Bureau of Labor Statistics, Labor Force Statistics from the Current Population Survey
U.S. Department of Labor, Employment and Training Administration, Unemployment Insurance Data
U.S. Federal Reserve, Economy at a Glance – Inflation (PCE)
ADP Employment Report
Carlyle
Revelio Labs
U.S. Tariffs on Track to Hit 84-Year High Under Current Proposals, Tax Foundation Says
The Kentucky Chamber hosted a webinar on June 9, 2025, featuring Vice President of Policy Charles Aull and Erica York, Vice President of Federal Tax Policy at the Tax Foundation, to explore how tariff and tax policies in Washington are shaping the economic landscape for Kentucky businesses.
Watch the webinar below: